General Structure Information
| PDB ID | 2rmn |
| HGNC Gene Label(s) | TP63 |
| Structure Name | the solution structure of the p63 dna-binding domain |
| Resolution | -1.0Å |
| Reference | AUTH A.ENTHART,J.FURRER,A.DEHNER,H.KESSLERTITL SOLUTION STRUCTURE AND BINDING STUDIES OF THE P63TITL 2 DNA BINDING DOMAINREF TO BE PUBLISHEDREFN |
Variant Set Distributions
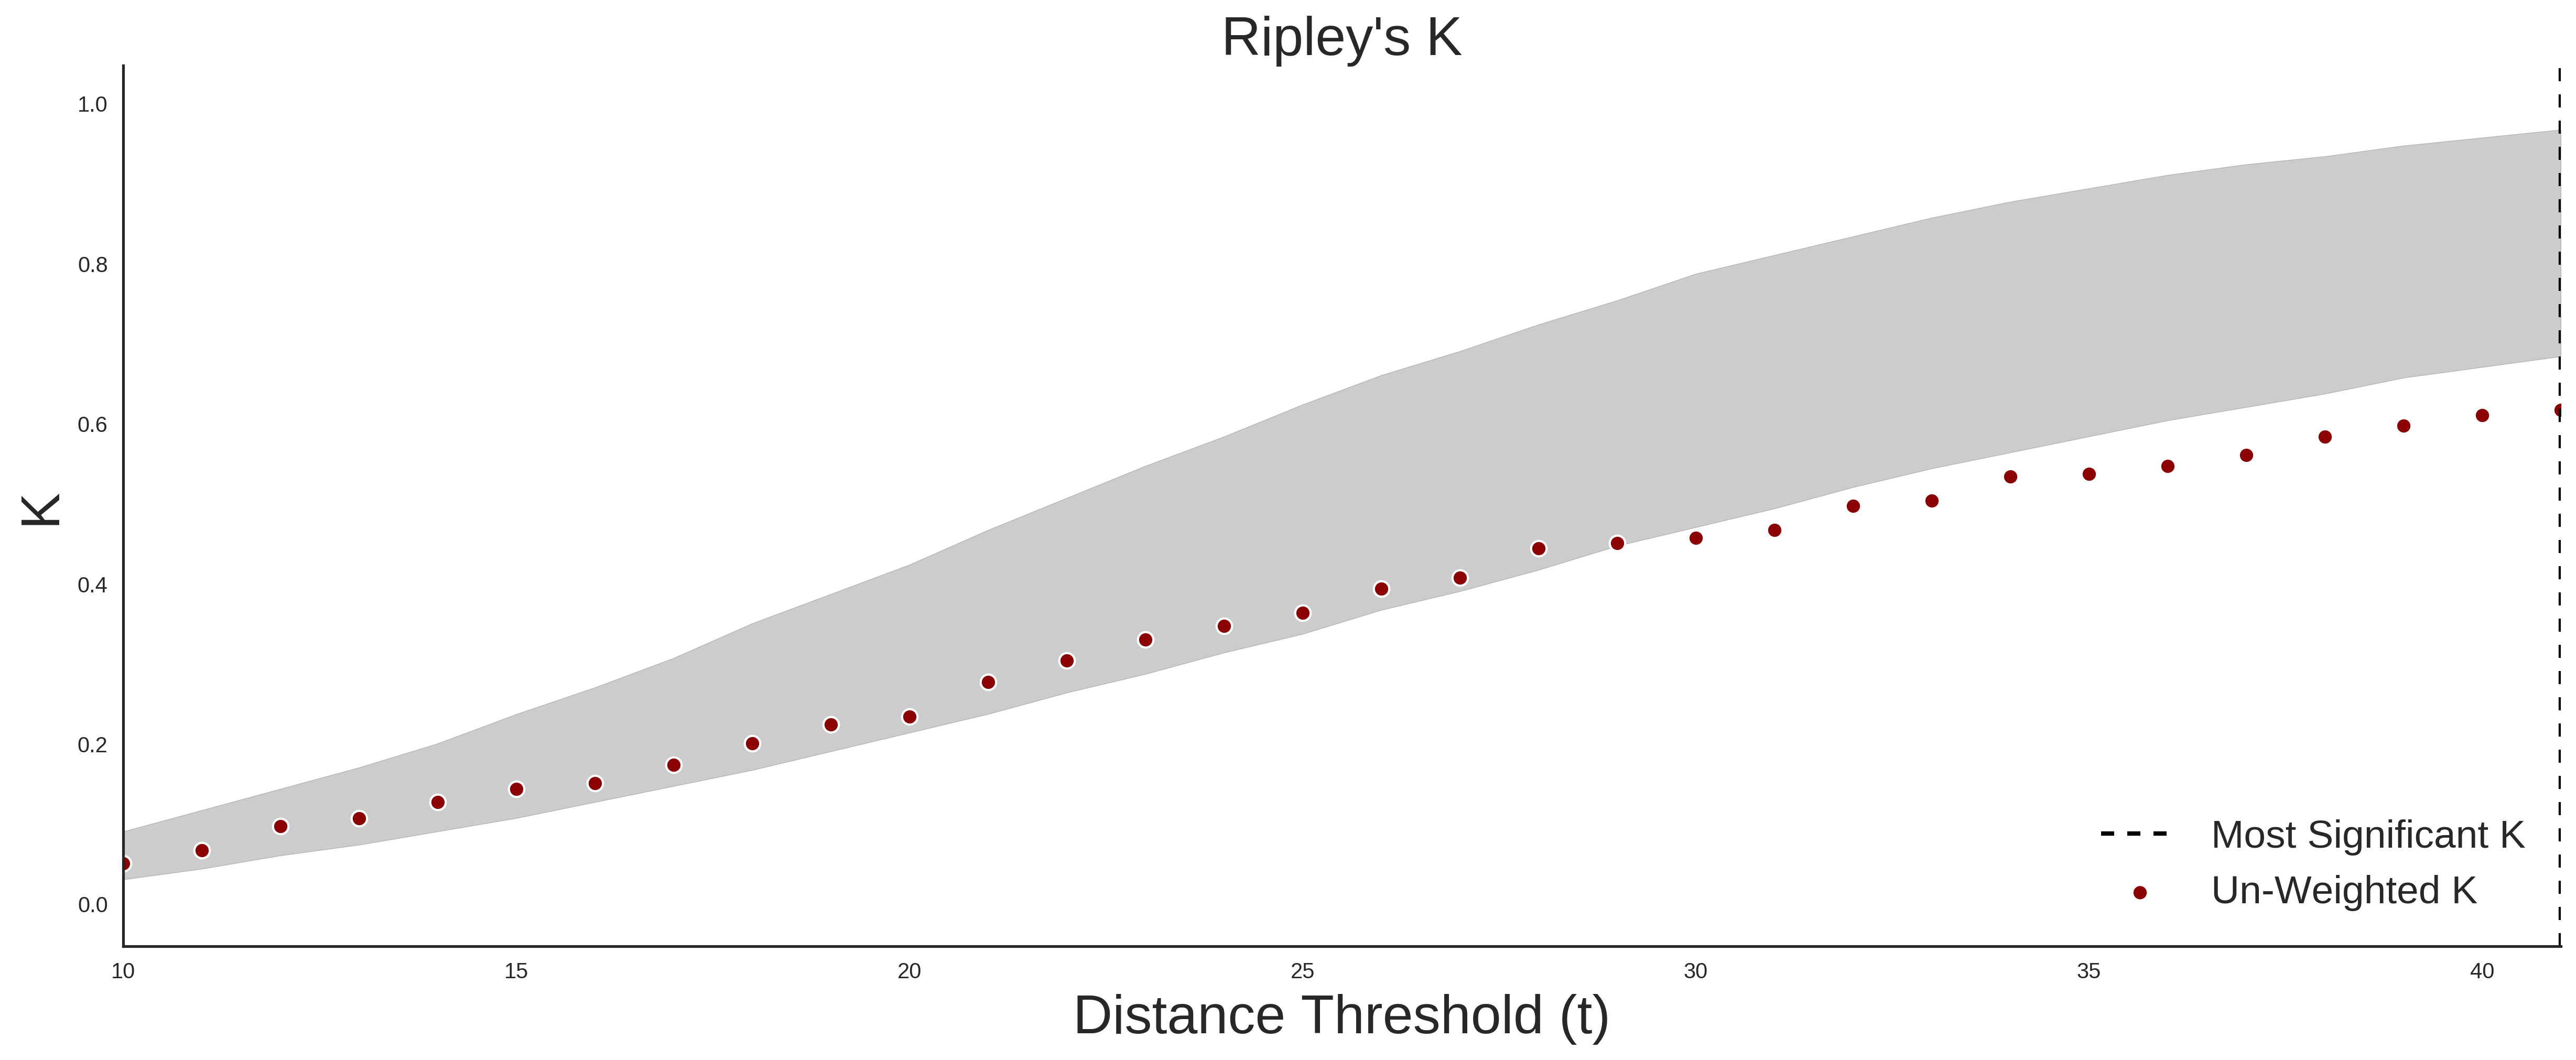
ExAC Variants
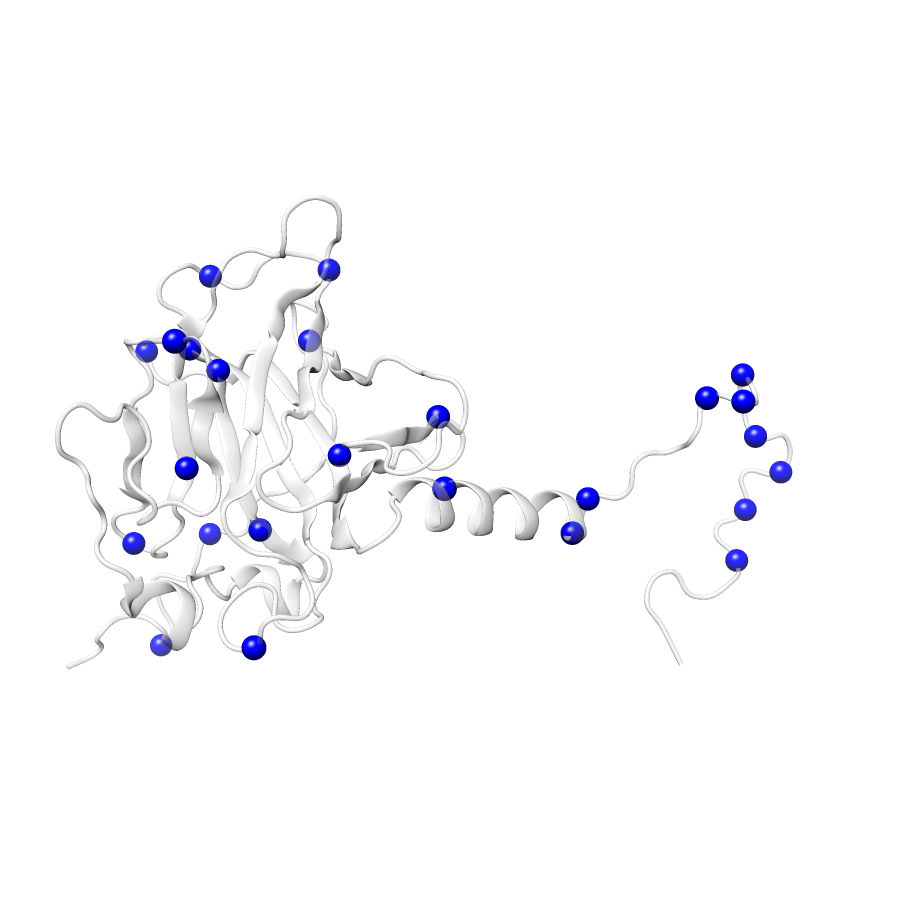
| Number Of Residues | 232 |
| Number Of SNVs | 27 |
| Number Of Permutations | 28220 |
| Optimal Distance Threshold | 25.0 |
| K Statistic | 0.379 |
| p-value | 0.399 |
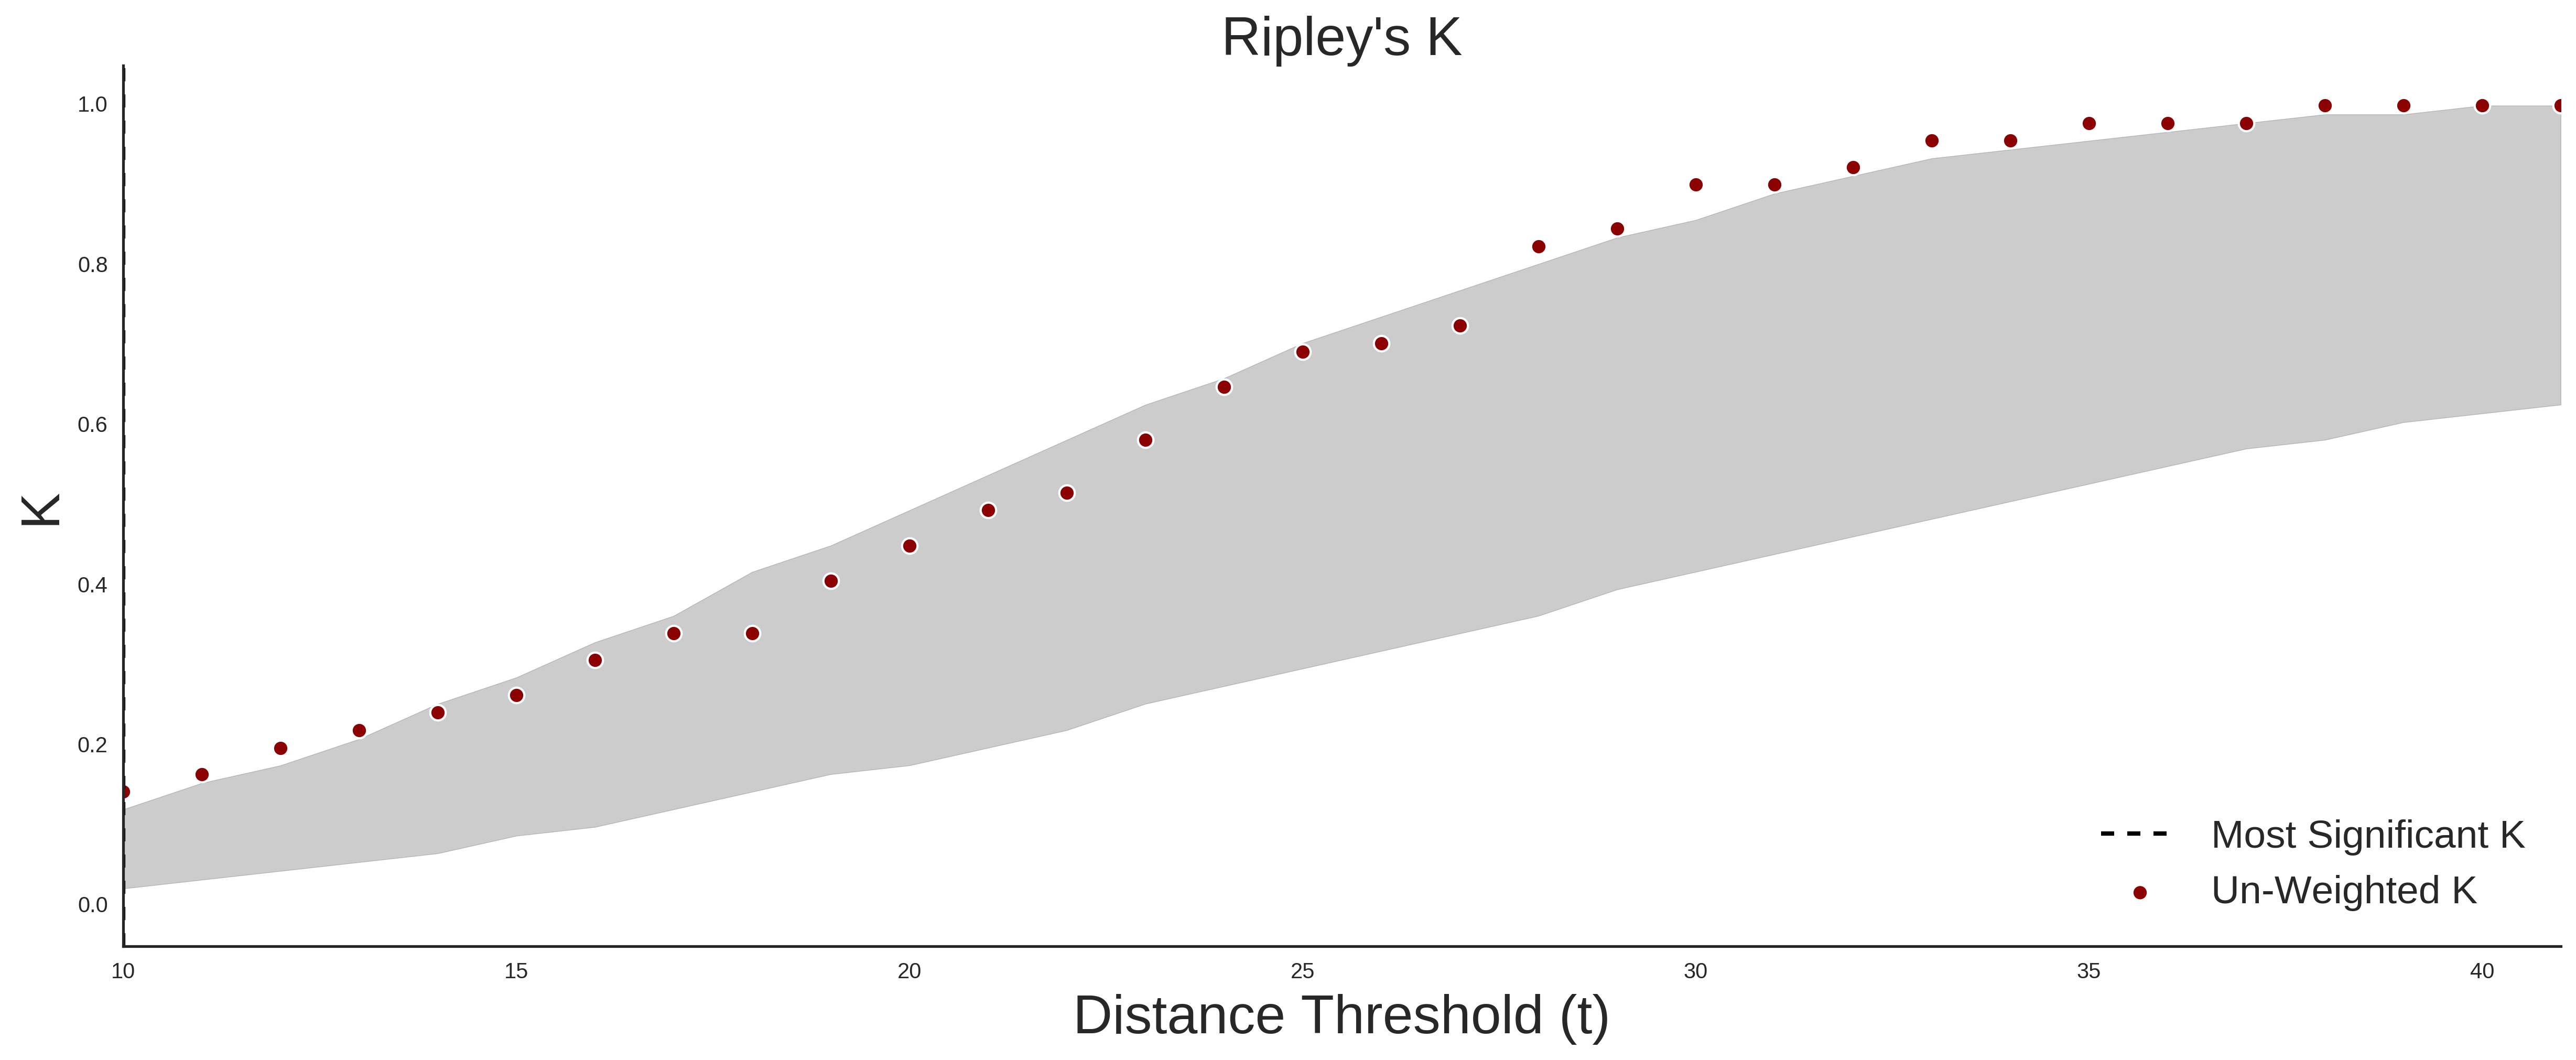
ClinVar
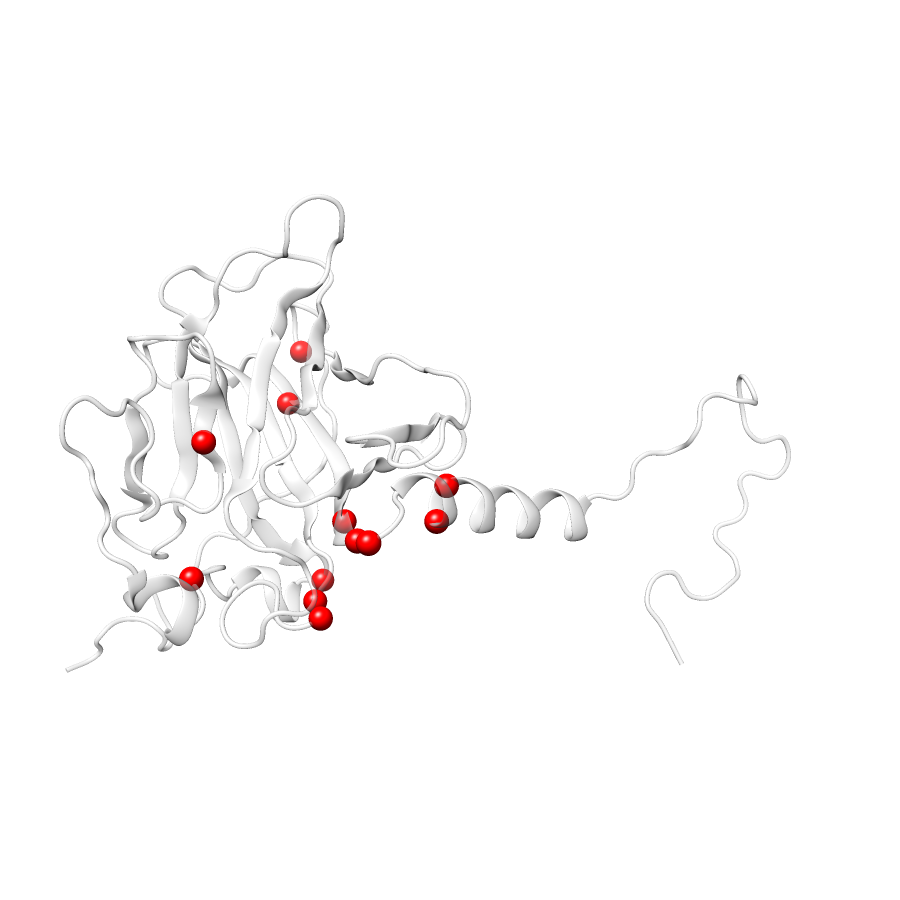
| Number Of Residues | 232 |
| Number Of SNVs | 12 |
| Number Of Permutations | 11659 |
| Optimal Distance Threshold | 9.0 |
| K Statistic | 0.136 |
| p-value | 0.038 |
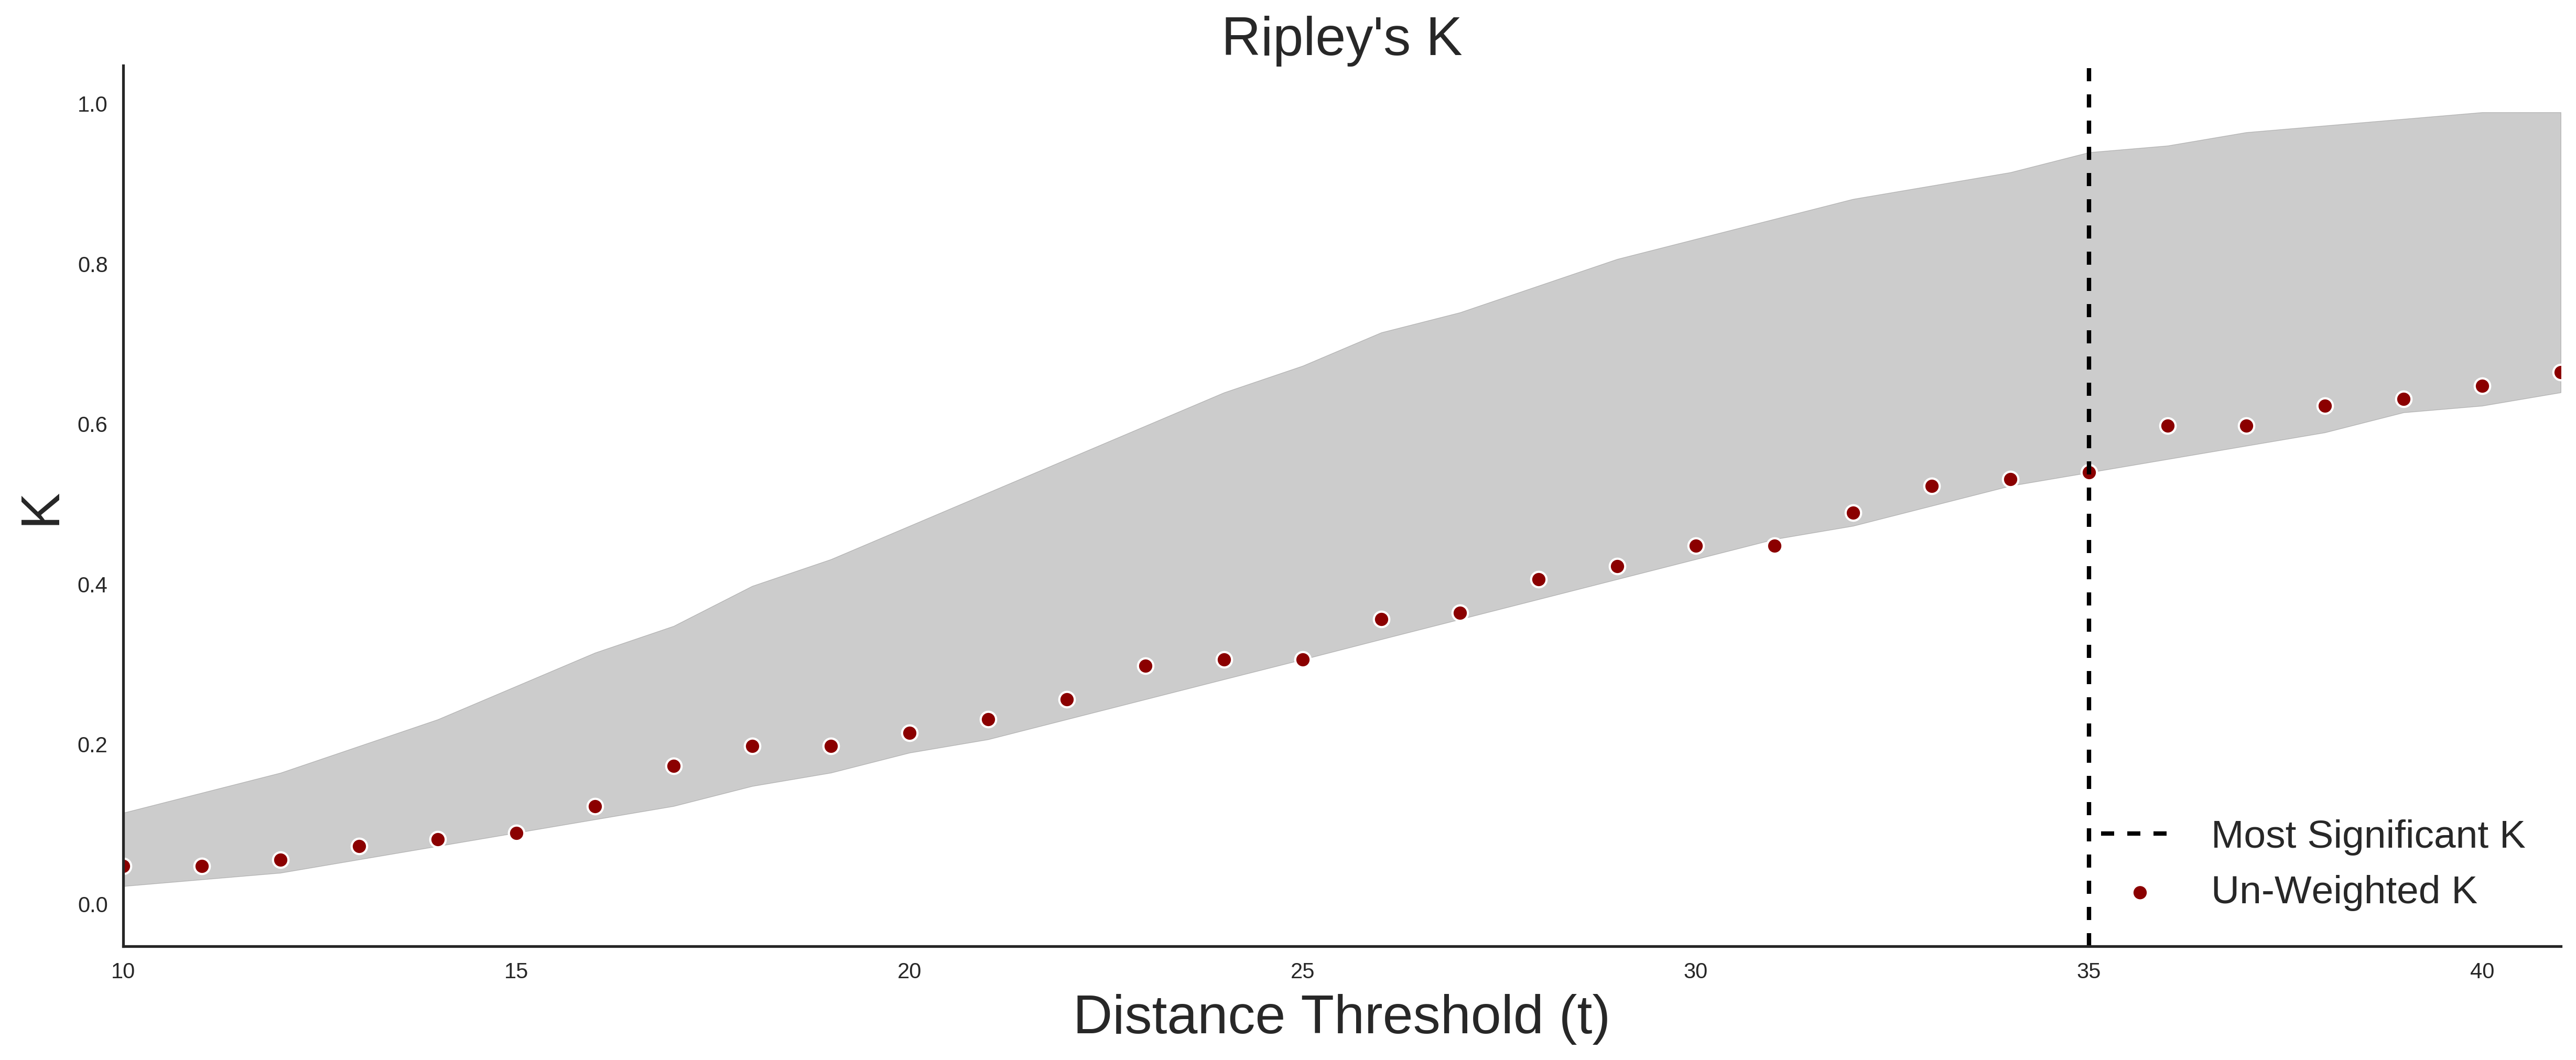
COSMIC
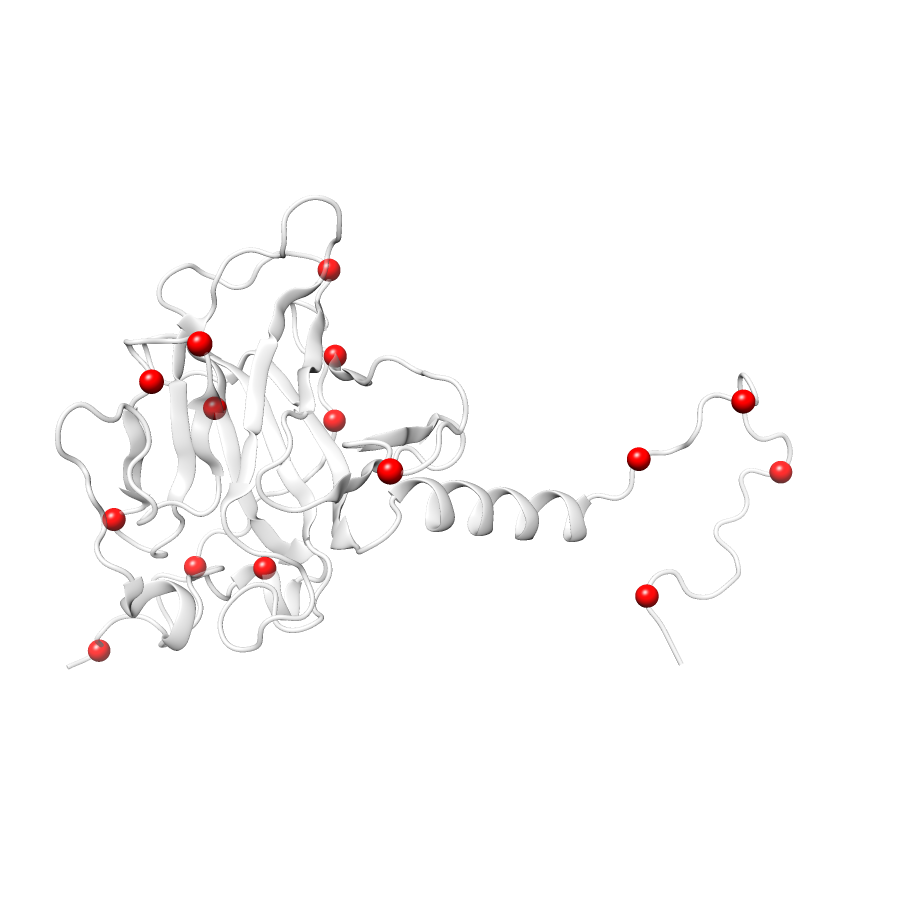
| Number Of Residues | 232 |
| Number Of SNVs | 11 |
| Number Of Permutations | 7027 |
| Optimal Distance Threshold | 38.0 |
| K Statistic | 0.527 |
| p-value | 0.038 |
Ripley’s K Analysis Plots
ExACClinVarCOSMIC
Variant Set Comparisons
ClinVar vs. ExAC
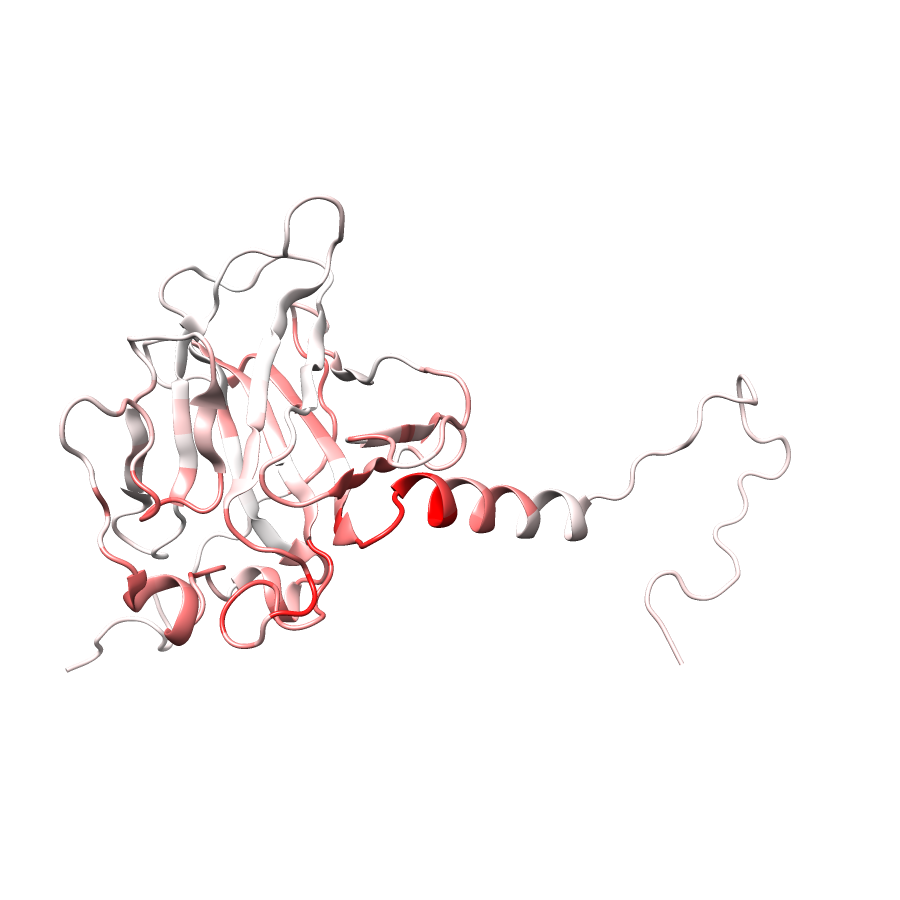
| Number Of ExAC SNVs | 27 |
| Number Of ClinVar SNVs | 12 |
| Optimal Distance Threshold | 9.0 |
| K Statistic | 0.091 |
| p-value | 0.006 |
Cosmic vs. ExAC
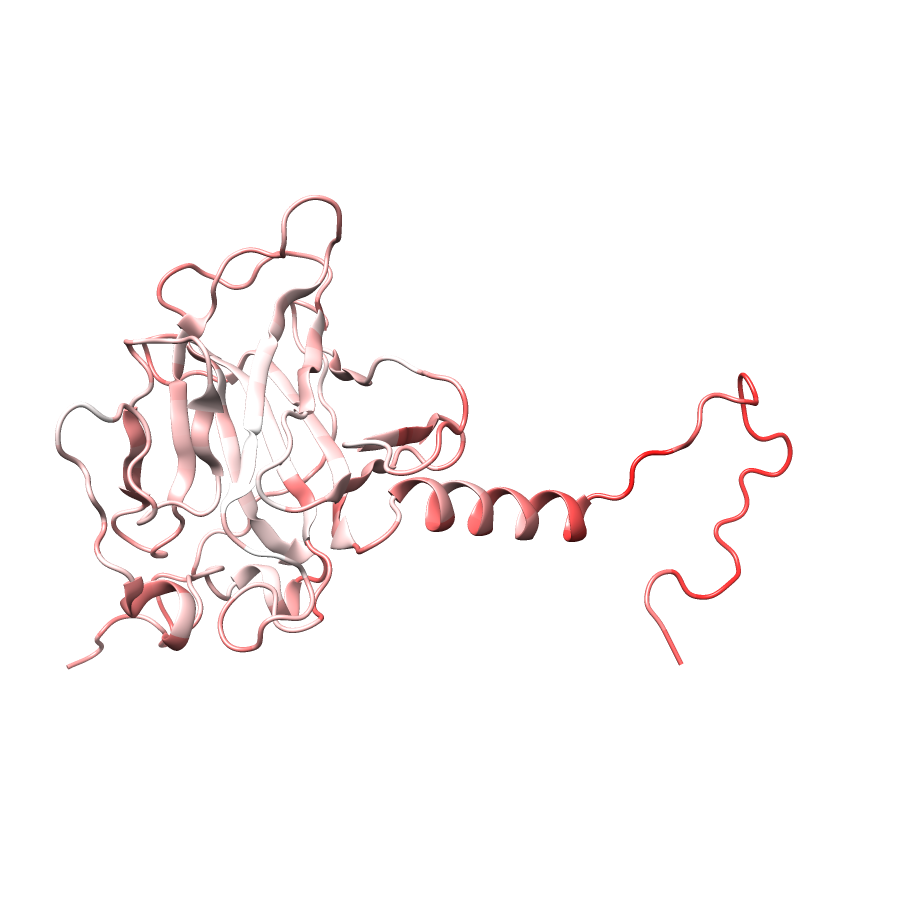
| Number Of ExAC SNVs | 27 |
| Number Of COSMIC SNVs | 15 |
| Optimal Distance Threshold | 12.0 |
| K Statistic | -0.058 |
| p-value | 0.392 |
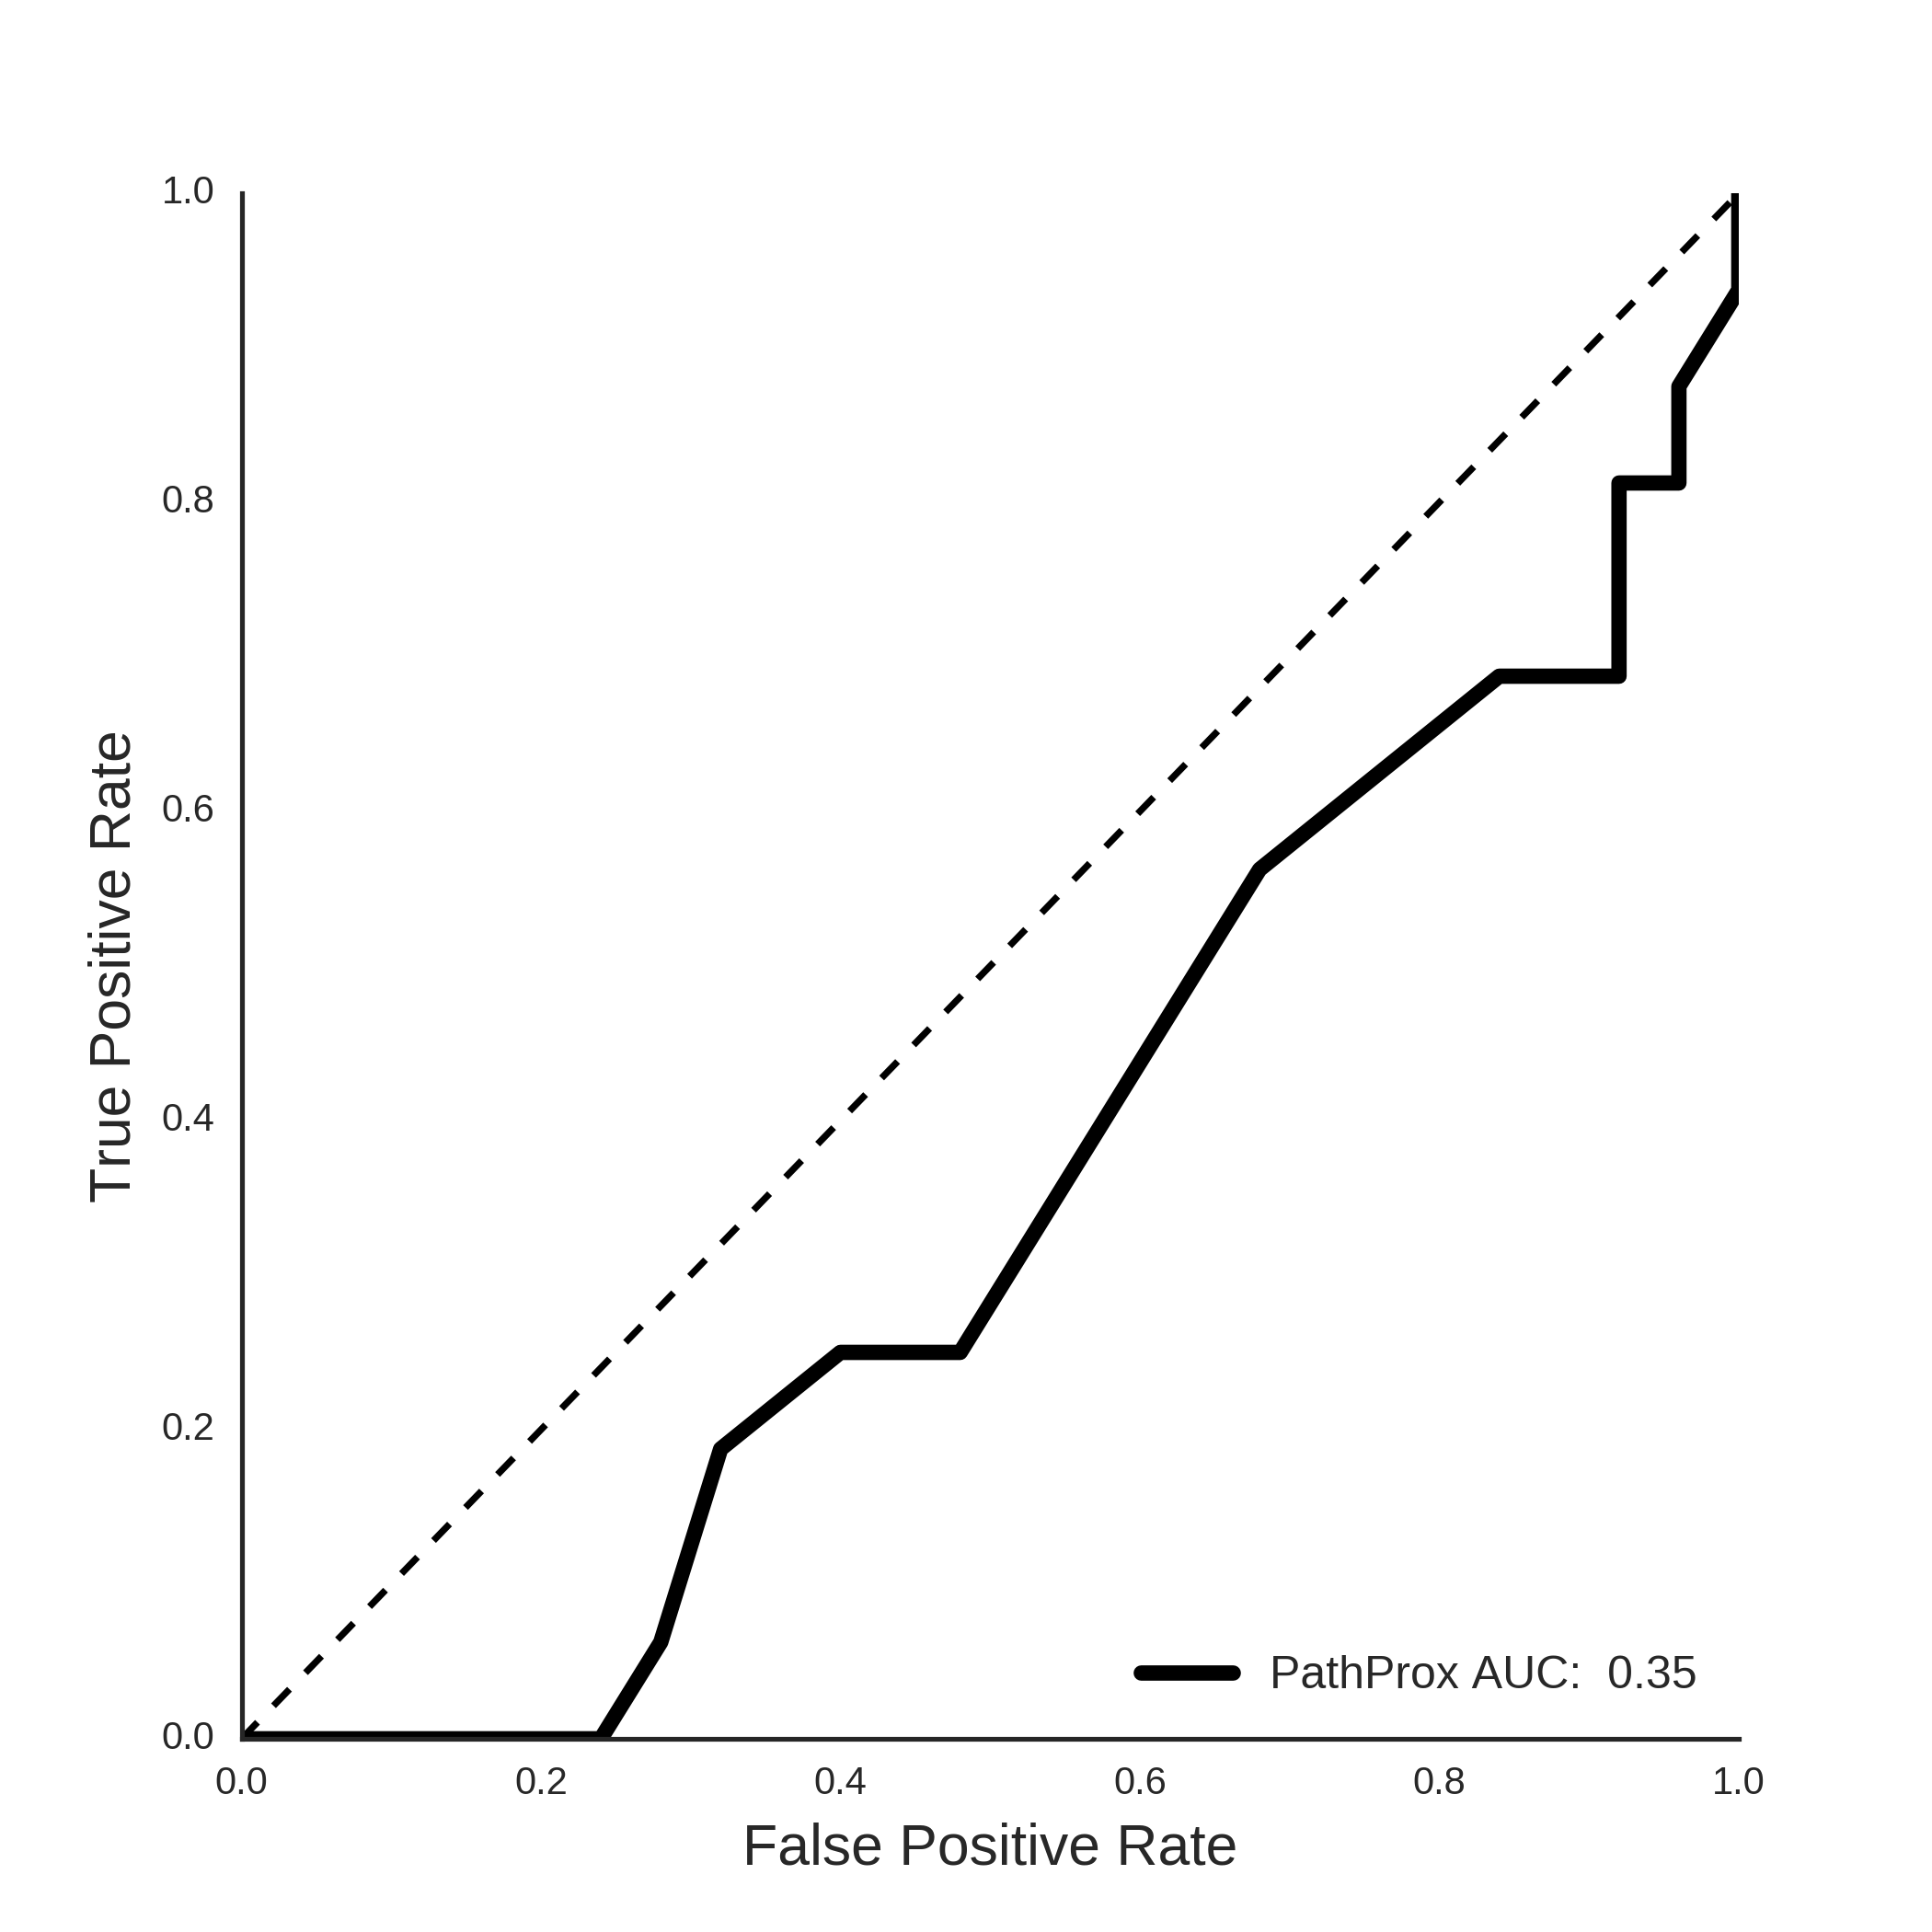
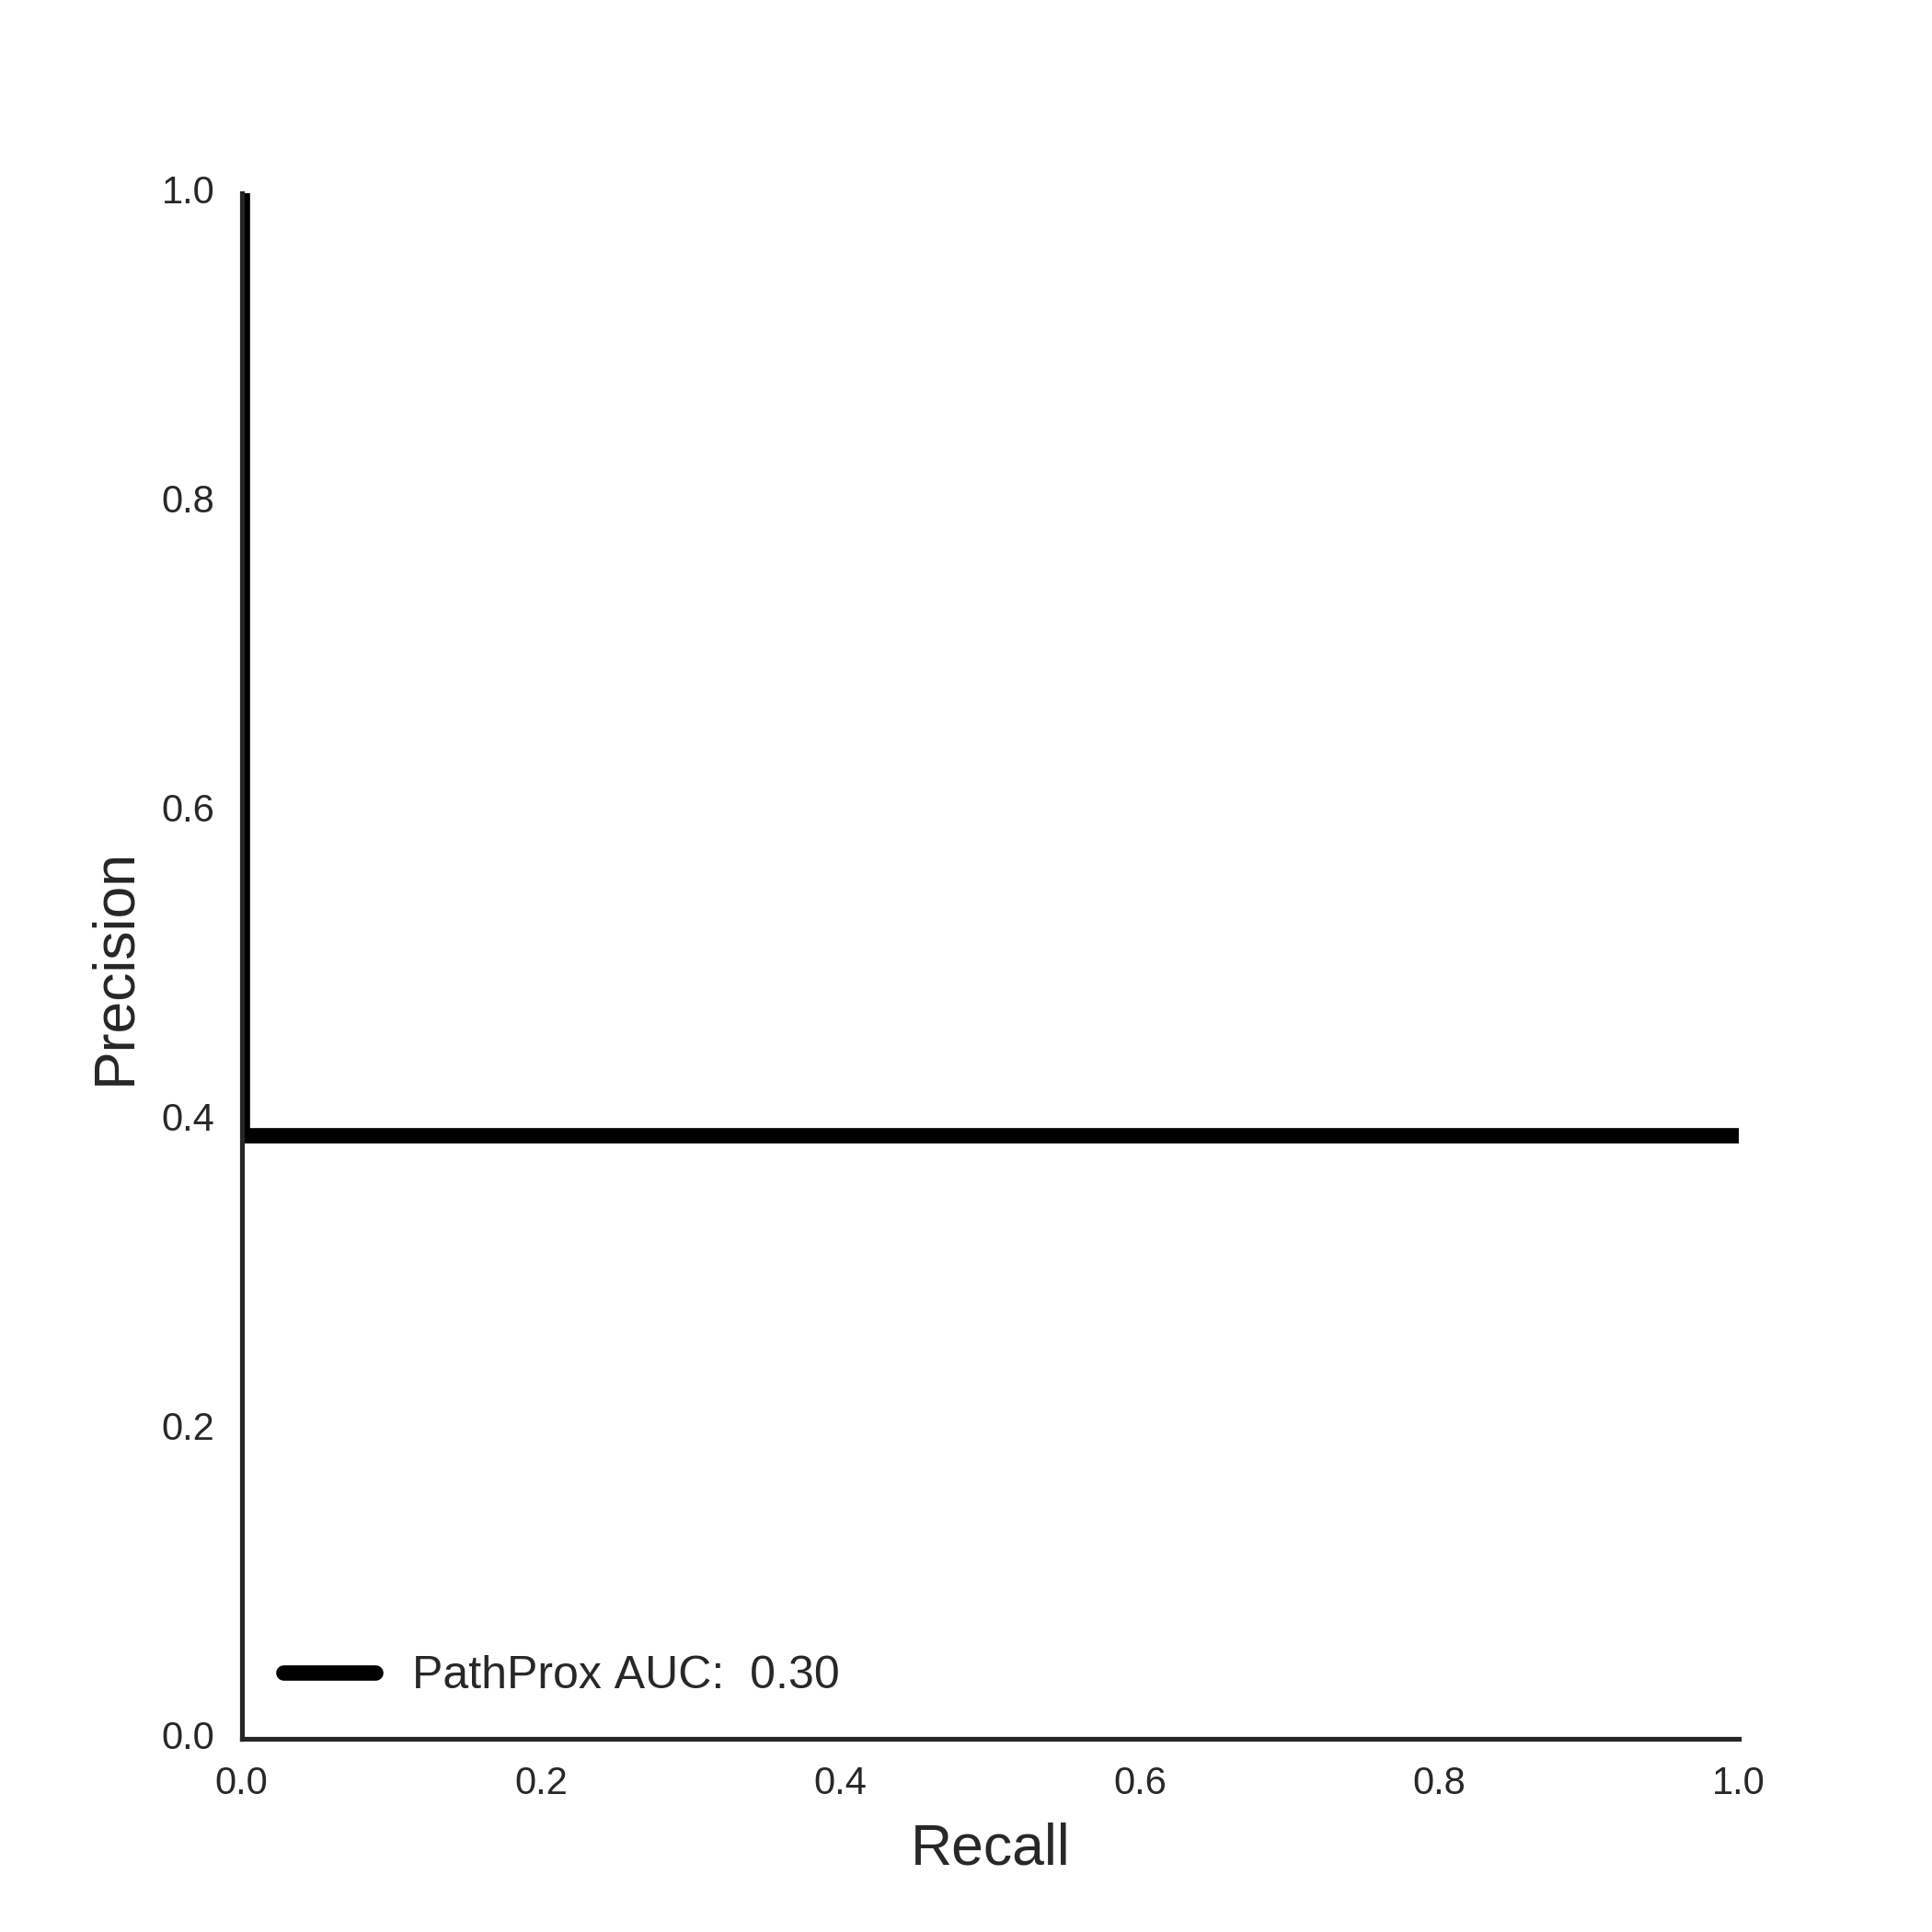
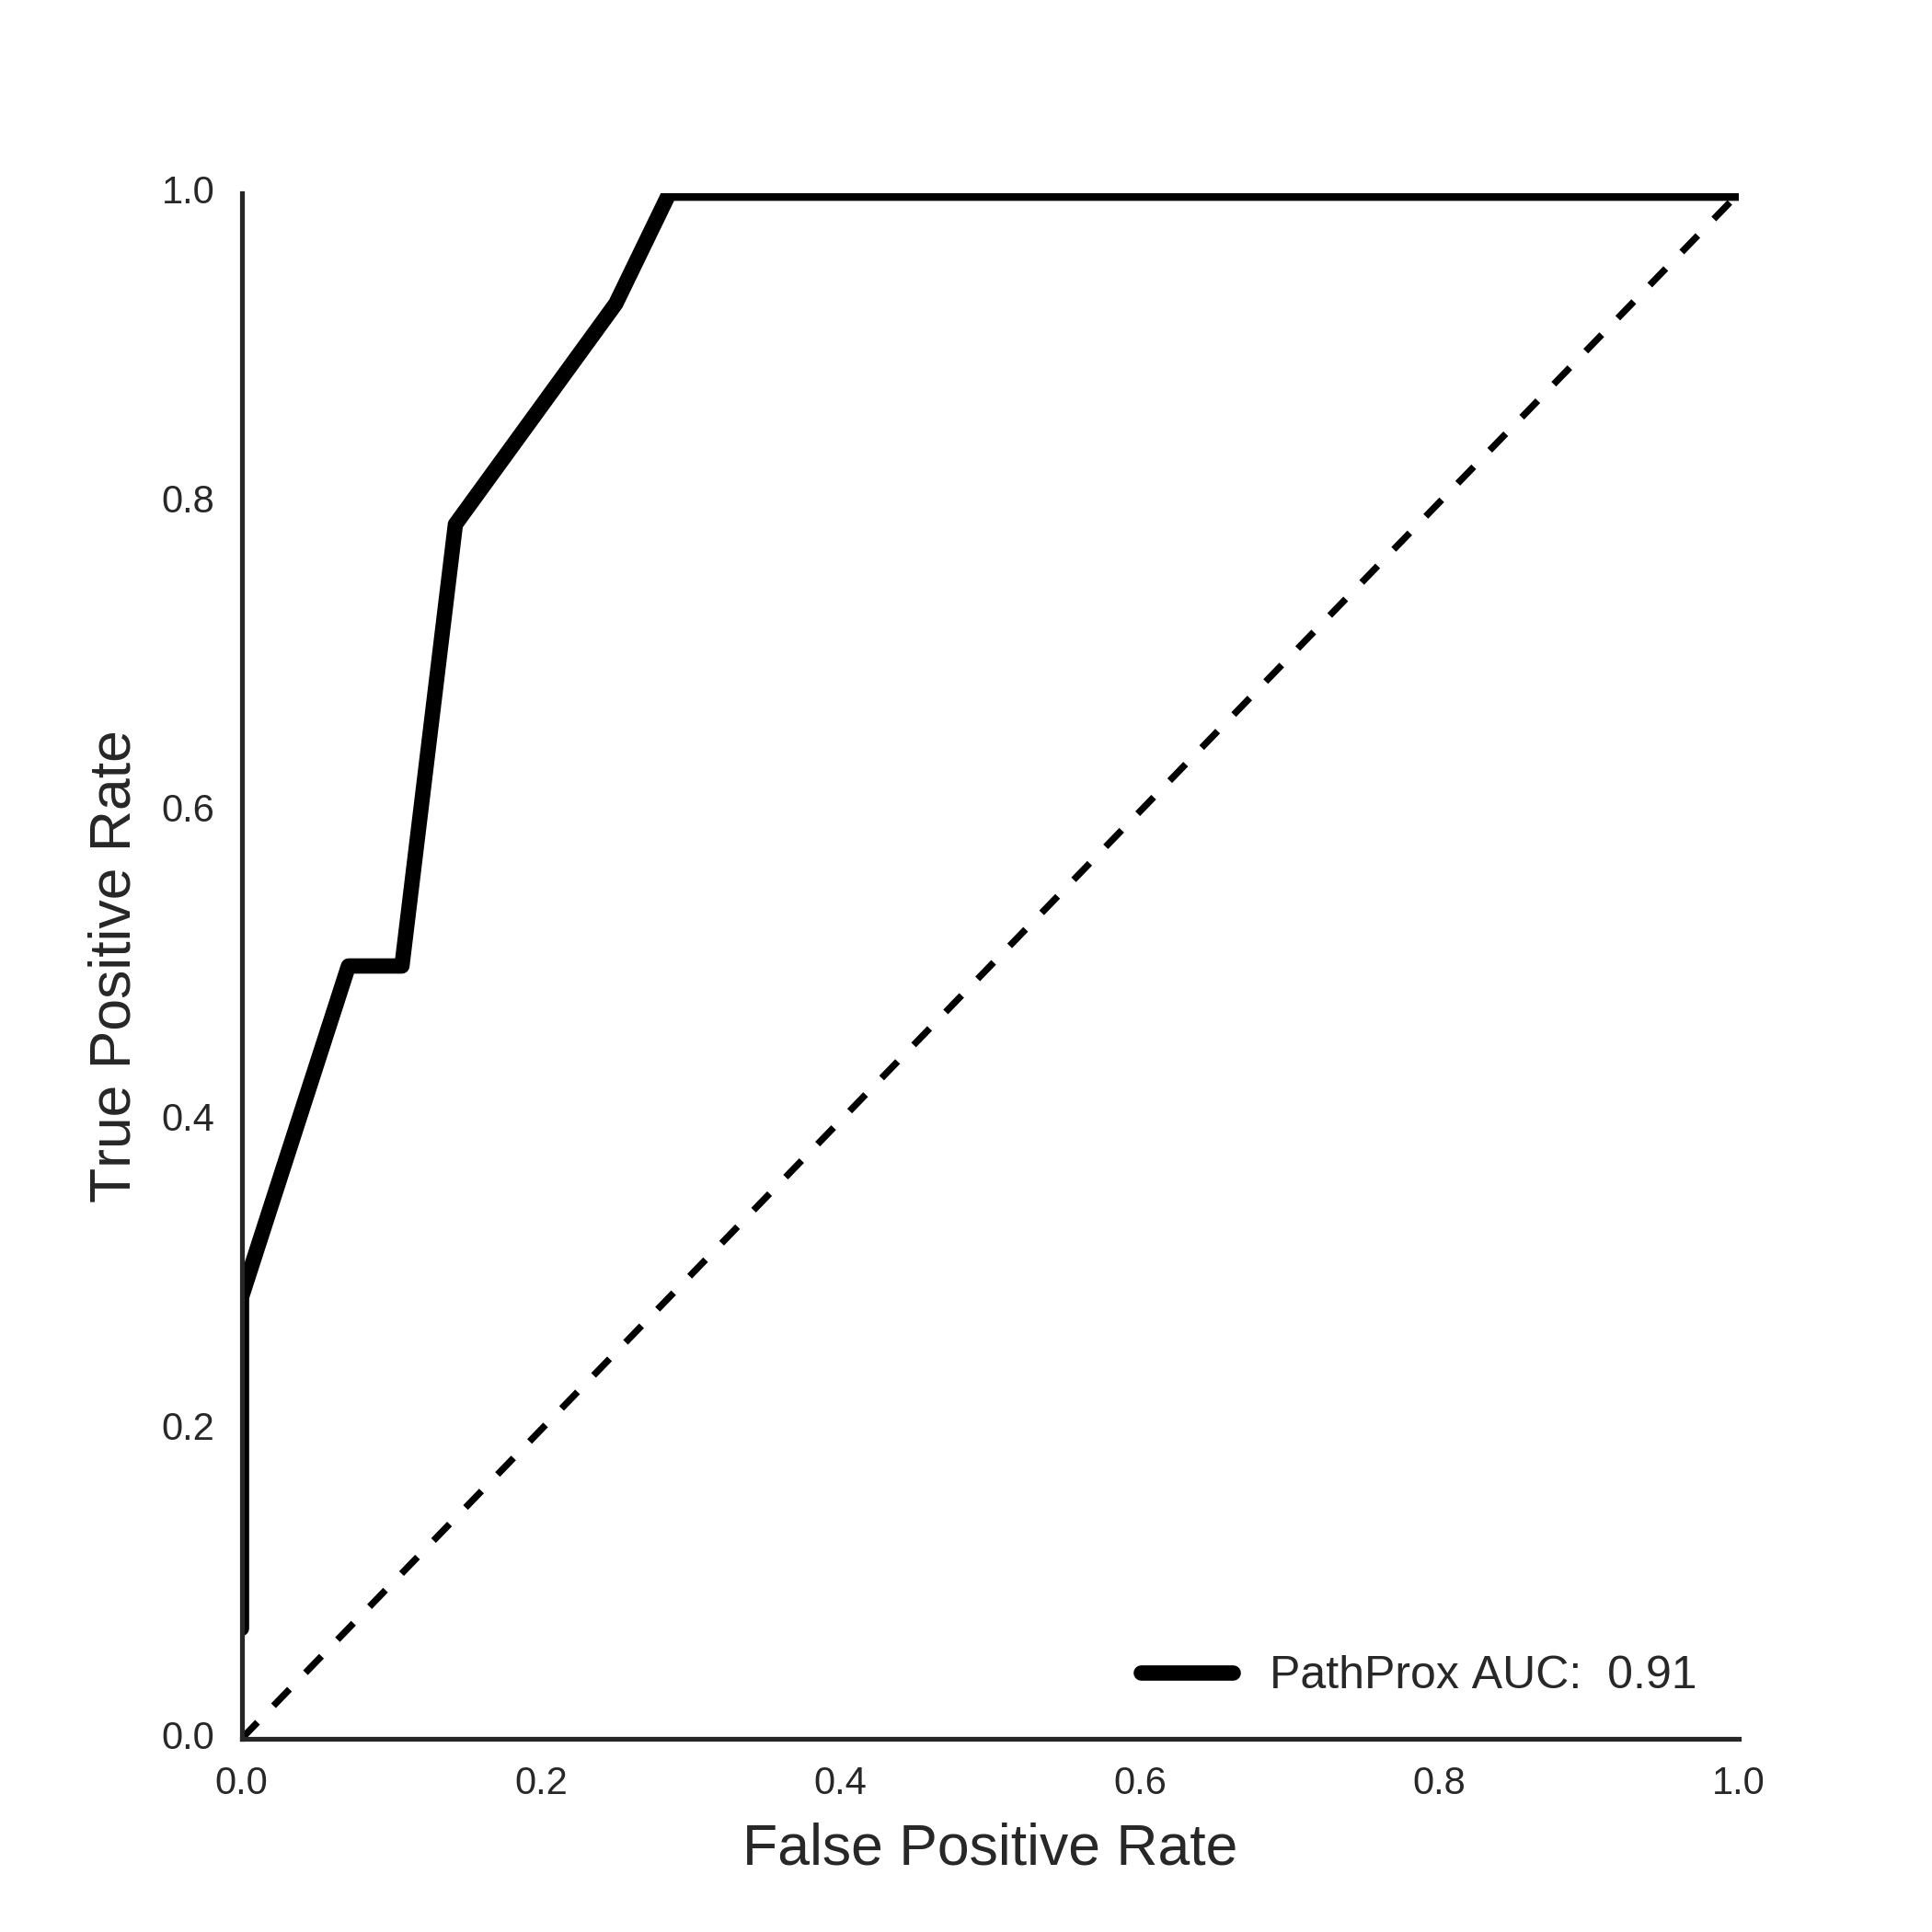
Pathogenic Proximity Analysis
ClinVar PathProx Analysis
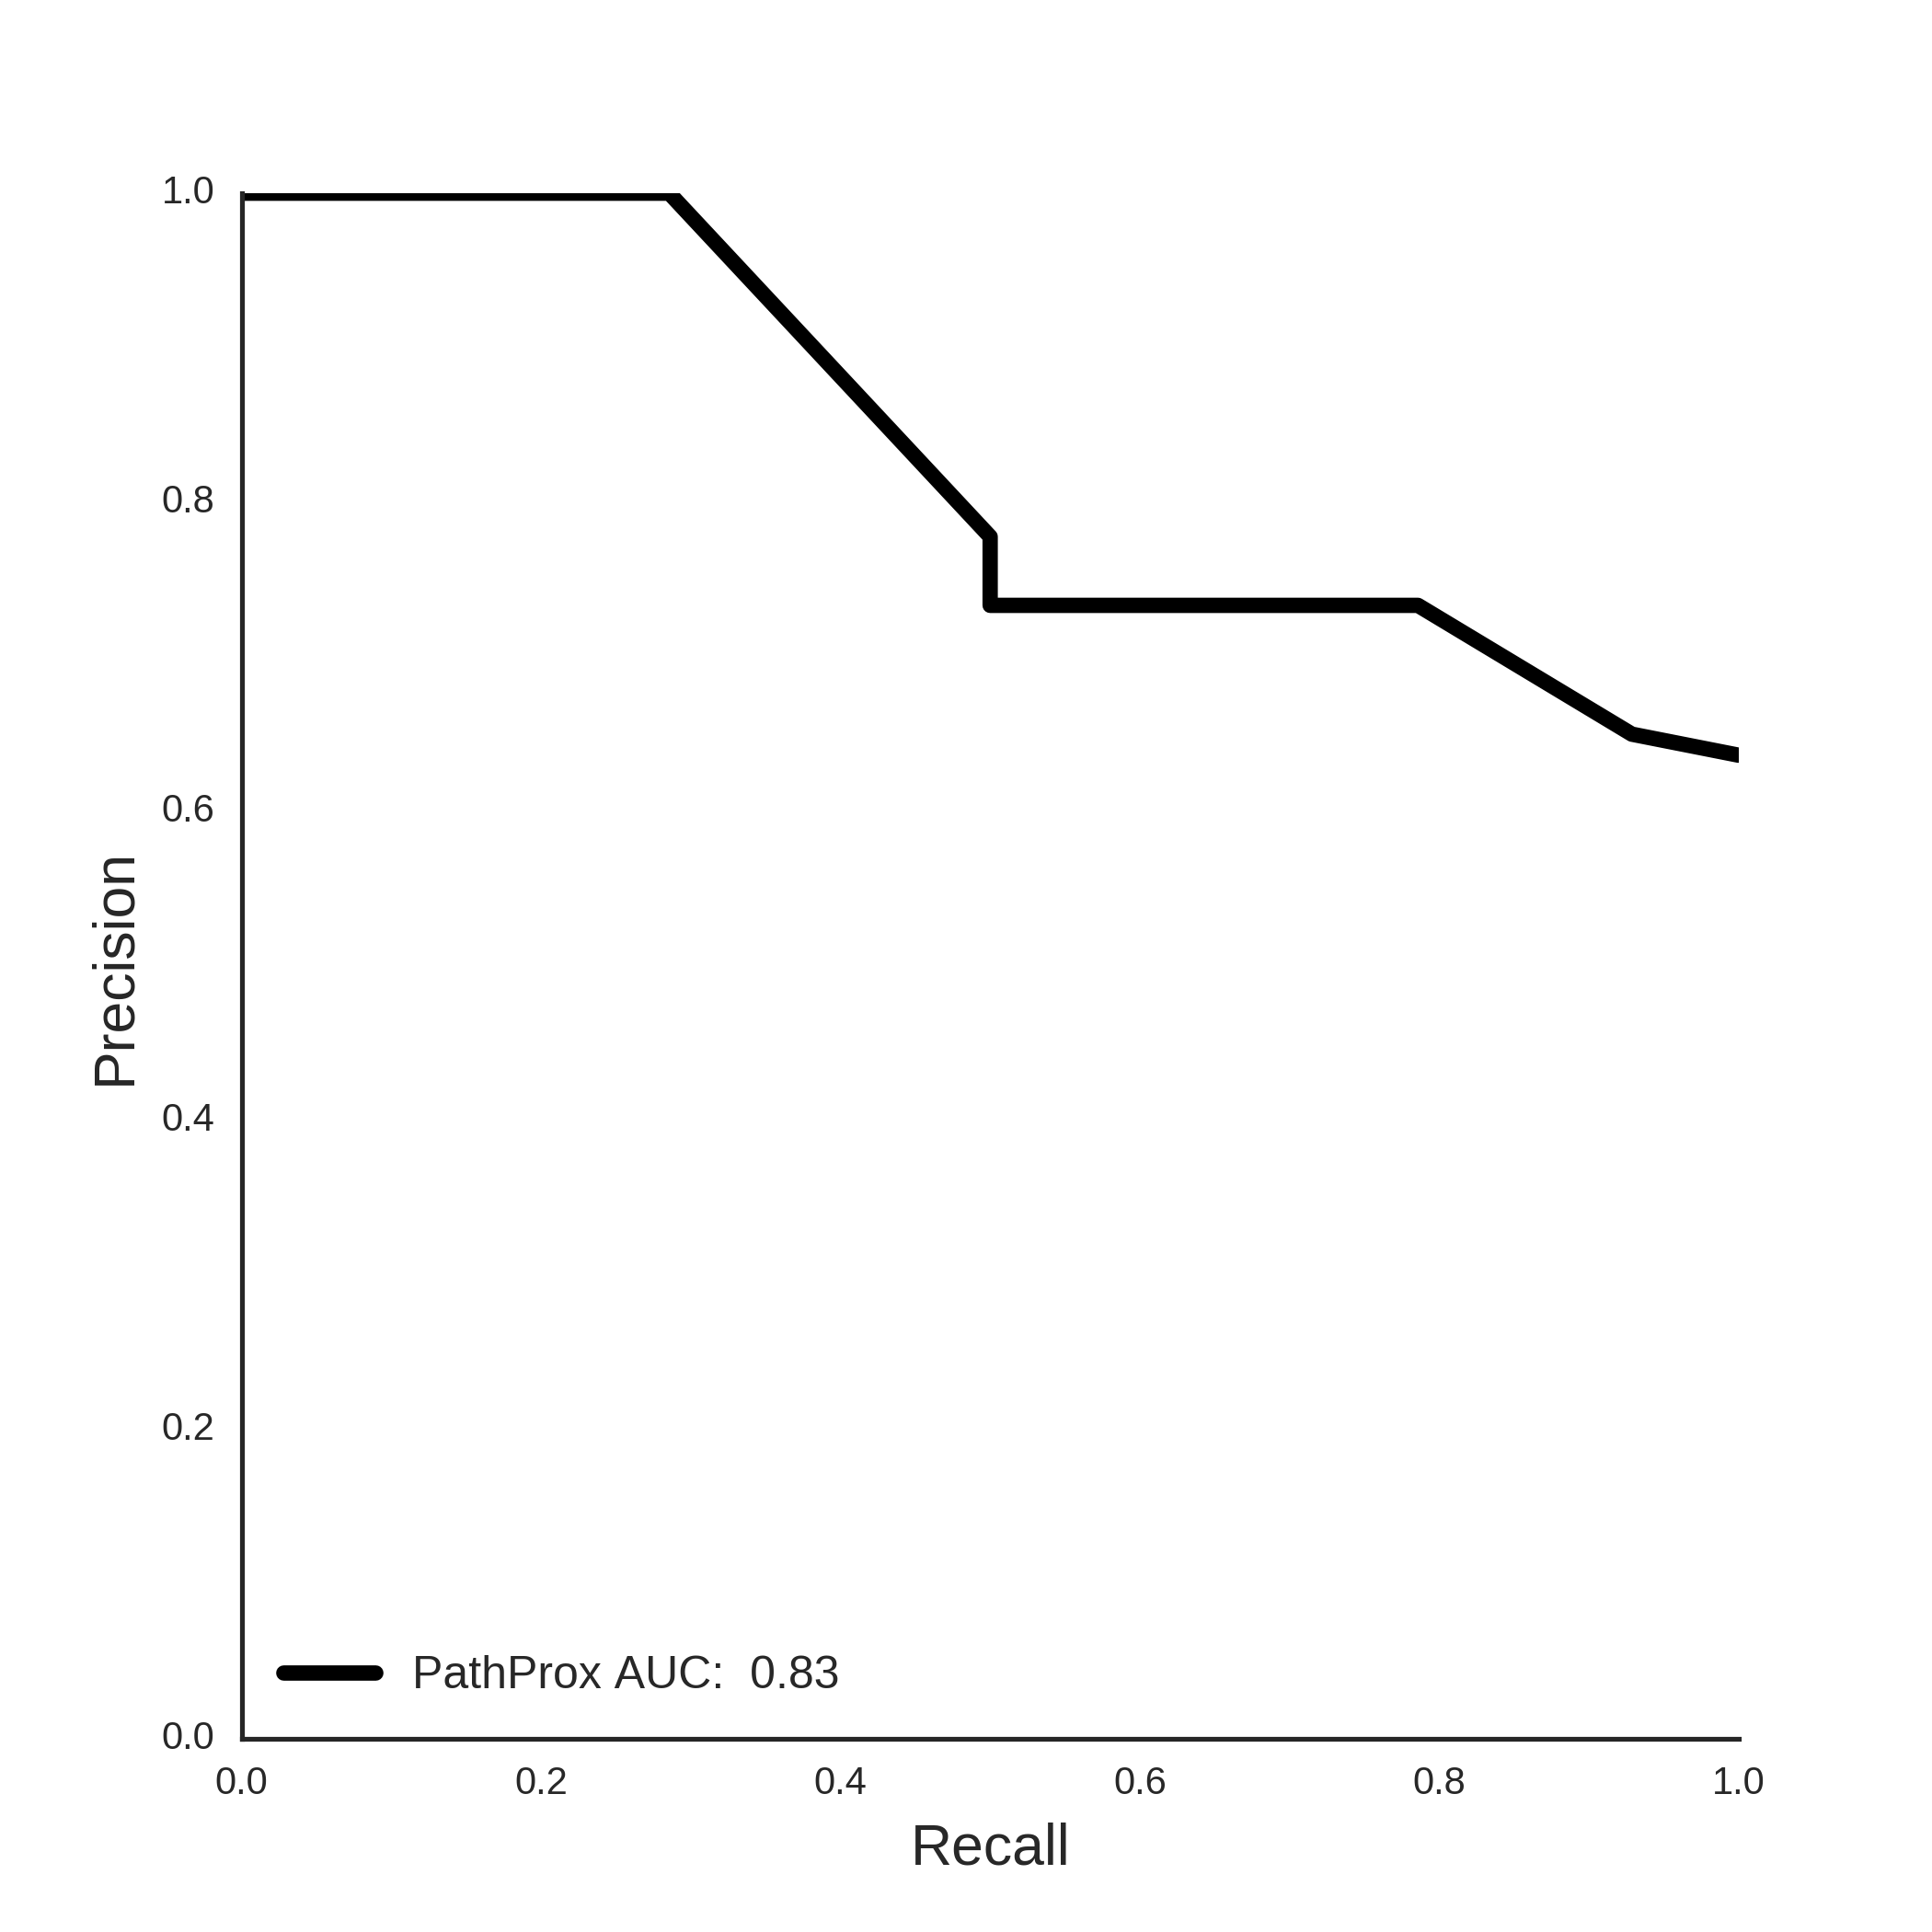
COSMIC PathProx Analysis